Where the Brunt Ice Shelf, growing inexorably from the edge of the Antarctic Ice Sheet, meets a obstacle protruding from the sea floor, the McDonald Ice Rumples are formed – a region of ice deformation, rift generation and shelf fracture. The animation combines images every week or so from the ESA Copernicus Sentinel-1 satellites.
In recent years fracturing has increased and Brunt Ice Shelf will soon lose an area the size of Greater London to a large calving event. Although significant in the known history of this ice shelf, this is believed to be a natural part of the cycle of growth and decay (de Rydt et al., 2019).
Please feel free to download and use this animated GIF.
Canada’s RADARSAT-1 was the first operational radar-based Earth Observation Satellite. RADARSAT-1 acquired numerous data collections from 1995 to 2013. The historical value of this data is clear as it allows making comparisons using images of the same region acquired over the years: for example, to study climate change effects.
The Canadian Space Agency has recently released over 37 000 RADARSAT-1 images for public use, free of charge; you can download them here. In light of this initiative, we are evaluating the feasibility of opening up more RADARSAT-1 data over Canada and internationally. Please answer the survey before 2019-06-28, by (Clicking here) in order to help us better understand your needs and preferences with respect to RADARSAT-1 data.
If you have already filled out this survey, please ignore this email. If you know other people who would like to fill out the survey, please provide them with this link: https://forms.gle/QRpso98XpTj2fnHF6. For any questions please contact julie.claveau@canada.ca
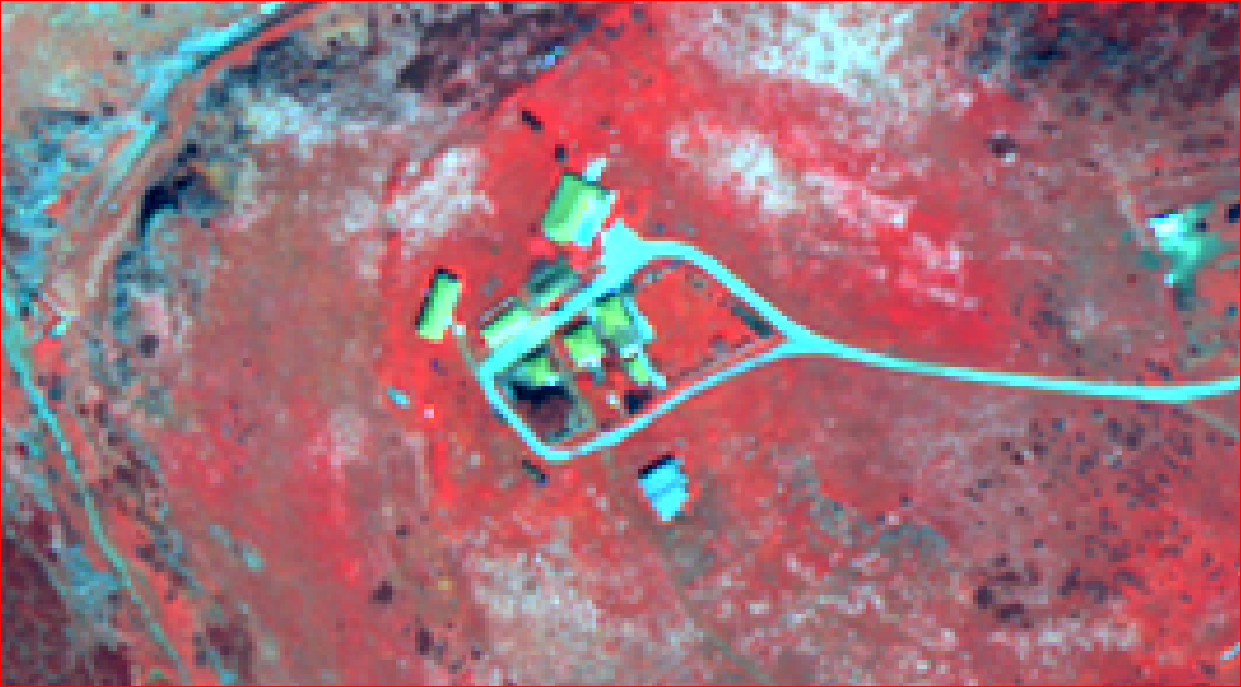
I was able to develop and test a code in R software using a simple pan sharpening formula (described here ) to create Pansharpened image of WorldView-2 (WV2) Multi-Spectral (MS) bands with high resolution Panchromatic (Pan) band. I have created a gif as shown in the figure above with Pan and MS ( a vegetation composite NIR2 in red, Yellow in green and Coastal in blue) images (data credit: esa).
Pansharpening is a process that merges/fuses high-resolution Pan data with medium-resolution MS data to create a high-resolution MS image (USGS).
WV2 is an imaging satellite of DigitalGlobe Inc., USA (a follow-on to WorldView-1 – WV1). WV2 sensor offers high resolution images in Pan 0.46 cm and unique MS 1.8 m at nadir. The MS bands are listed in the table below (credit: DigitalGlobe):
Band Name
Wavelength
Detail
Coastal Blue
400 – 450 nm
New band Absorbed by chlorophyll in healthy plants and aids in conducting vegetative analysis Least absorbed by water, and will be very useful in bathymetric studies Substantially influenced by atmospheric scattering and has the potential to improve atmospheric correction techniques
Blue
450 – 510 nm
Identical to QuickBird Readily absorbed by chlorophyll in plants Provides good penetration of water Less affected by atmospheric scattering and absorption compared to the Coastal Blue band
Green
510 – 580 nm
Narrower than the green band on QuickBird Able to focus more precisely on the peak reflectance of healthy vegetation Ideal for calculating plant vigor Very helpful in discriminating between types of plant material when used in conjunction with the Yellow band
Yellow
585 – 625 nm
New band Very important for feature classification Detects the “yellowness” of particular vegetation, both on land and in the water
Red
630 – 690 nm
Narrower than the red band on QuickBird and shifted to longer wavelengths Better focused on the absorption of red light by chlorophyll in healthy plant materials One of the most important bands for vegetation discrimination Very useful in classifying bare soils, roads, and geological features
Red-Edge
705 – 745 nm
New band Centered strategically at the onset of the high reflectivity portion of vegetation response Very valuable in measuring plant health and aiding in the classification of vegetation
NIR1
770 – 895 nm
Narrower than the NIR1 band on QuickBird to provide more separation between it and the Red-Edge sensor Very effective for the estimation of moisture content and plant biomass Effectively separates water bodies from vegetation, identifies types of vegetation and also discriminates between soil types
NIR2
860 – 1040 nm
New band Overlaps the NIR1 band but is less affected by atmospheric influence Enables broader vegetation analysis and biomass studies
I have also created a gif as shown in the figure above with Pan and MS ( a shadow composite NIR2 in red, Red Edge in green and Yellow in blue) images to compare results.
Panchromatic BandComposite NIR2, Yellow and Blue (Before Pansharpening)Composite NIR2, Yellow and Blue (After Pansharpening)
Sentinel 5P March 01 to 05, 2019 are mapped using R software. Darker red areas are high levels of nitrogen dioxide (NO2) as shown over East of China, a highly industrialized populated area. Sentinel-5P have spatial resolution of 7 x 3.5 KM.
The Copernicus Sentinel-5P (S5P) data is available (here) for download since July 2018 to monitor air quality and changes in ozone over Antarctica. The TROPOspheric Monitoring Instrument (TROPOMI) is the single sensor on board of the S5P satellite. The S5P is the first of the atmospheric composition Sentinels (operational satellite missions supporting the Copernicus programme), launched in 2017, for a nominal lifetime of 7 years. S5P, is a gap-filler and a preparatory programme covering products and applications for Sentinel-5. The S5P mission will fill the gap between the end of the Ozone Monitoring Instrument (OMI) and SCIAMACHY exploitation and the Sentinel-5 mission (credit: ESA).
This high spatial resolution data is useful for air pollution to locate origin of key pollutants (trace gases such as sulfur dioxide in the atmosphere) and finding pollution hotspots. Measurements of atmospheric ozone from the Copernicus S5P satellite are now being used in daily forecasts of air quality.
List of Sentinel-5P level 2 products are show in the table (credit: KNMI):
European Space Agency (ESA) – Sentinel-5P (credit ESA)
Data Download
The S5P data in “pre ops” phase can be downloaded from the scihub https://scihub.copernicus.eu/ . I downloaded a level 2 NO2 file in netCDF format (.nc files).
search results are shown
Data visualization
The downloaded netcdf file first imported into “Panoply netCDF Visualization Software”
The browser shows contents (variables) of the netcdf file.
The user can easily create a line plot.
2D plot with several map projections options
Copyright/Credit contains modified Copernicus Sentinel data (2018), processed by DLR/BIRA
One added value of Copernicus Atmosphere Monitoring Service (CAMS) ozone products compared to satellite total column retrievals is that CAMS provides 3D global fields. This allows structures like the Antrctic ozone hole to be viewed in a different way. This animation shows a cross section of the ozone layer (in partial pressure) over the South Pole from 1 July to 25 November 2018 and illustrates the development and recovery of the ozone hole.
Copyright/Credit Processed by CAMS/ECMWF
The reduction of ozone concentrations in the stratosphere and the formation of the ozone hole each year are caused by complex meteorological and chemical processes. Changes in the ozone between 7 July and 22 November 2018 are displayed here as a 3D rendered animation.
Copyright/Credit processed by CAMS/ECMWF
More Information available:
Tropomi.eu (KNMI R&D Satellite Observations here )
What a beauty can be found in NO2 animated map. Thanks to @CopernicusECMWF for their forecast. Look closely, even oil platforms are clearly visible. pic.twitter.com/70v35zeOPt
We’re in Milan for #LPS19 and the latest science from Europe’s Sentinel satellites… like the new #Sentinel5P, which returns daily views of pollution. It shows nitrogen dioxide, mostly from fossil-fuel burning. This is data averaged for March 2019. pic.twitter.com/H2xXJZaNFX
Pakistan’s Gomal Zam Dam is a gravity dam in South Wazirstan, Pakistan. The dam construction was started in 2001 and completed in April, 2011. The temporal and spatial coverage captured by Landsat TM and Landsat 8 images (USGS – NASA Landsat Program) are shown here.
The United Nations (UN) Sustainable Development Goal 6 (SDG 6) is to ensure clean, accessible water for all. Water quality not only affects human health but it also disturb ecosystems, biodiversity, food production and economic growth. The Earth Observations (EO) data is now an important input to science-based informed decision making management tools. The IIWQ World Water Quality Portal, which was developed in the framework of UNESCO’s International Hydrological Programme (IHP) International Initiative on Water Quality (IIWQ), is a pioneering tool to monitor water quality using Earth Observation. The Portal addresses an urgent need to enhance the knowledge base and access to information to member states in implementing the SDG 6, as well as several other Goals and Targets that are linked directly to water quality and water pollution. The tool also help to understand the impacts of climate- and human-induced change on water security (Thomas Heege, Chief Executive Officer of EOMAP).
Sarantuyaa Zandaryaa, Programme Specialist, Division of Water Sciences at IHP, UNESCO says:
“The portal is not only an important contribution to improved global water quality information, but also promotes science- and data-based decision-making on water quality, which will lead to sustainable water resource management towards achieving the SDGs. In view of scarce water quality information – both globally and nationally – the Portal will be a valuable tool to obtain water quality information, especially in remote areas and in developing regions (such as in Africa, Asia, Latin America, and Small Island Developing States) where there is a lack of water quality monitoring networks and laboratory capacity. It is also a decision-making tool and will help countries identify the most pressing water quality problems such as pollution hotpots. Hence, the portal will support national efforts for the implementation of water quality related SDG targets as well as for monitoring progress towards their realisation,”
The online portal will also help developing countries like Pakistan to build capacity and competence in their technical and administrative infrastructures. The maps in following figures shows:
Chlorophyll-a CHL an essential pigment included in phytoplankton cells and therefore a measure of phytoplankton. The displayed CHL is calculated from total scattering and total organic absorption of water constituents. Unit is [µg/l].
Harmful Algae Blooms (HAB) indicator shows possible areas affected by harmful algae blooms formed by cyanobacteria containing phycocyanin.
Total Absorption (ABS) is the absorption of organic and anorganic of water components is provided as absorption unit in [1/m].
Turbidity measures the degree to which light is being backscattered by particles in the water.Turbidity caused by scattering of particles is provided in Formazine Turbidity Unit [FTU].
Figure: Karachi a Metropolitan city located on the coastline of Sindh province in southern Pakistan, along a natural harbour on the Arabian Sea. (1) Turbidity and (2) Chlorophyll-a.
Figure: The Jehlum river near Mandi Bhauddin in Punjab, Pakistan. (1) Chlorophyll-a , (2) HAB indicator (probability), (3) Total Absorption, and (4) Turbidity.
Figure: The Mangla Dam is a multipurpose dam located on the Jhelum River in the Mirpur District of Azad Kashmir. (1) Chlorophyll-a , (2) HAB indicator (probability), (3) Total Absorption, and (4) Turbidity.
Figure: Gomal Zam Dam is a multi-purpose gravity dam in South Waziristan Agency of Federally Administered Tribal Areas (FATA), Pakistan. (1) Chlorophyll-a , (2) HAB indicator (probability), (3) Total Absorption, and (4) Turbidity.
Figure: Ghazi-Barotha Hydropower Project is a 1,450 MW run-of-the-river hydropower connected to the Indus River about 10 km west of Attock in Punjab, Pakistan. (1) Chlorophyll-a , (2) HAB indicator (probability), (3) Total Absorption, and (4) Turbidity.
Note: Please read the information booklet for further information on the water quality products and to learn more about the validity range of the products. Products are generated independent on any form of ground truth data, and inter-comparable over the various resolutions provided. The Chlorophyll and HAB indicator may have site-specific limitations e.g. for extremely humid, calcareous, or ferruginous waters, and can be improved with local adaptations. General restrictions are caused by clouds, optical shallow waters, or undetected artefacts from e.g. cloud shadows.
RECENT combines a data from Multiple Satellites Observations Monitor and Assess Impact from Drought in Regional Scale. Daily/Monthly Drought index data with Satellite Rainfall and Land Surface Temperature are available to Visualize and Download through this Web Site (http://iis.gic.ait.ac.th).
The RECENT service is available for countries; Bangladesh, Bhutan, Cambodia, China, India, Indonesia, Lao_PDR, Mongolia, Myanmar, Nepal, Pakistan, Philippines, SriLanka, Thailand & Vietnam.
Monitoring air pollutants distribution in urban areas are critical for public health and safety. A country like Pakistan with no network of advanced weather stations to extract high quality data to derive information products is very important. Trend maps of pollutants and other information parameters derived from satellite remote sensing data is a replicable technique to integrate into management decisions. This allows city management to effectively monitor visibility and air quality concerns informing public for to take effective measures.
Following are examples of the available satellite remote sensing products for air quality measurements.
Aerosol Optical Depth/Thickness product provides information on aerosol in the atmosphere.
Fires and Thermal Anomalies product shows active fire detection (including crop burning) and thermal anomalies.
Normalized Difference Vegetation Index (NDVI) is a measure of greeness and health of vegetation.
1. Aerosol Optical Depth
MODIS (Terra and Aqua) Combined Value-Added Aerosol Optical Depth (Temporal Coverage: 31 January 2013 – present). The MODIS (Terra and Aqua) Combined Value-Added Aerosol Optical Depth layer is a value-added layer based on MODIS Level 2 aerosol products. The layer can give a quick, synoptic view of the level of aerosol in the atmosphere.. MODIS Aerosol Optical Depth (or Aerosol Optical Thickness) layer indicates the level at which particles in the air (aerosols) prevent light from traveling through the atmosphere. Aerosols absorb and scatter incoming sunlight, which reduces visibility and increases the optical depth. An optical depth of less than 0.1 indicates a clear sky with maximum visibility, and a value of 1 indicates the presence of aerosols so dense that people would have difficulty seeing the Sun. Aerosols have an effect on human health, weather and the climate. Sources of aerosols include pollution from factories, smoke from fires, dust from dust storms, sea salts, and volcanic ash and smog. Aerosols compromise human health when inhaled by people with asthma or other respiratory illnesses. Aerosols also have an affect on the weather and climate by cooling or warming the earth, helping or preventing clouds from forming.
This level 3 gridded product is designed for quantitative applications including aerosol data assimilation and model validation. This layer is useful for aerosol forecasting communities such as the United States Navy Fleet Numerical Meteorology and Oceanography Center (FNMOC), National Oceanic and Atmospheric Administration (NOAA), European Centre for Medium-Range Weather Forecasts (ECMWF), National Aeronautics and Space Administration (NASA) Global Modeling Assimilation Office (GMAO), University research groups and support for field/aircraft campaigns.
The MODIS Combined Value-Added Aerosol Optical Depth layer is a near real-time layer and available as a combined Terra satellite and Aqua satellite layer (MCDAODHD). The sensor resolution is 0.5 degrees, imagery resolution is 2 km, and the temporal resolution is daily.
References: NASA Earthdata – NRT Value-Added MODIS AOD Product; GCMD Entry: MCDAODHD
2. Fire and Thermal Anomalies
MODIS (Terra) Fire and Thermal Anomalies Temporal Coverage: 8 May 2012 – present. The MODIS Fire and Thermal Anomalies layer shows active fire detections and thermal anomalies, such as volcanoes, and gas flares. Fires can be set naturally, such as by lightning, or by humans, whether intentionally or accidentally. Fire is often thought of as a menace and detriment to life, but in some ecosystems it is necessary to maintain the equilibrium, for example, some plants only release seeds under high temperatures that can only be achieved by fire, fires can also clear undergrowth and brush to help restore forests to good health, humans use fire in slash and burn agriculture, to clear away last year’s crop stubble and provide nutrients for the soil and to clear areas for pasture. The fire layer is useful for studying the spatial and temporal distribution of fire, to locate persistent hot spots such as volcanoes and gas flares, to locate the source of air pollution from smoke that may have adverse human health impacts.
The MODIS Fire and Thermal Anomalies product is available from the Terra (MOD14) and Aqua (MYD14) satellites as well as a combined Terra and Aqua (MCD14) satellite product. The sensor resolution is 1 km, and the temporal resolution is daily. The thermal anomalies are represented as red points (approximate center of a 1 km pixel) in the Global Imagery Browse Services (GIBS)/Worldview.
Normalized Difference Vegetation Index (NDVI) (rolling 8-day) MODIS rolling 8-day Normalized Difference Vegetation Index (NDVI). The MODIS Normalized Difference Vegetation Index (NDVI) layer is a measure of the greenness and health of vegetation. The index is calculated based on how much red and near-infrared light is reflected by plant leaves. The index values range from -0.2 to 1 where higher values (0.3 to 1) indicate areas covered by green, leafy vegetation and lower values (0 to 0.3) indicate areas where there is little or no vegetation. Areas with a lot of green leaf growth, indicates the presence of chlorophyll which reflects more infrared light and less visible light, are depicted in dark green colors, areas with some green leaf growth are in light greens, and areas with little to no vegetation growth are depicted in tan colors.
The MODIS rolling 8-day NDVI layer is available as a near real-time, rolling 8-day product (MOD13Q4N) from from the Terra satellite. It is created from a rolling 8-day land surface reflectance product, MOD09Q1N. The sensor resolution is 250 m, imagery resolution is 250 m, and the temporal resolution is an 8-day product which is updated daily.
References: NASA Earth Observatory – Measuring Vegetation; NASA Earthdata – New Vegetation Indices and Surface Reflectance Products Available from LANCE; NASA NEO – Vegetation Index


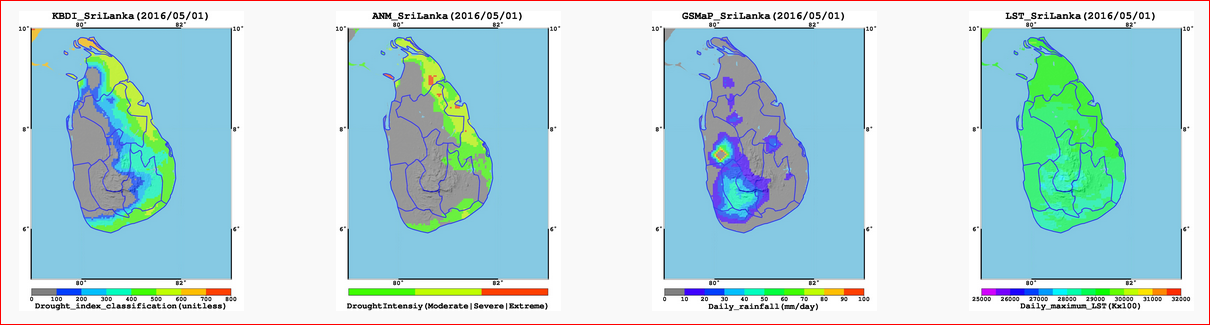

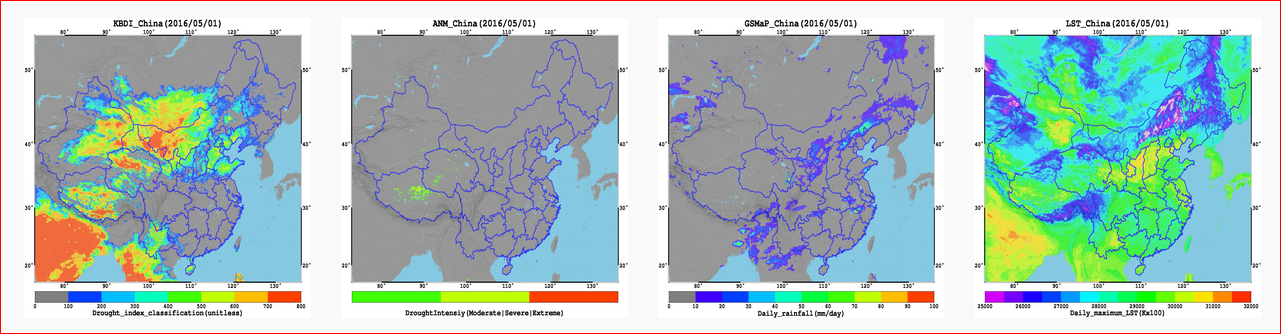
 Satellite observed Rainfall and Land Surface Temperature data are used here to obtain a daily drought product called Keetch-Byram Drought Index (KBDI), which ranges from 0 (wet condition) to 800 (dry condition). Anomaly of drought index (KBDI) which is deviation from long term average if Drought Index is an Indicator of Drought Condition. Hourly global rainfall data at 0.1° spatial resolution is obtained from GSMaP NRT System by Japan Aerospace Exploration Agency (JAXA). It is derived from microwave radiometers (e.g., TMI, AMSR-E and SSM/I) and infrared radiometers (e.g., MTSAT, METEOSAT and GOES). This is an hourly rainfall product which is available to public after 4 hours after the observations. Land Surface Temperature (LST) data are obtained from MTSAT, a weather satellite of the Japan Meteorological Agency (JMA) with a spatial resolution of 4 km. LST is observed in every 30 minutes using 4 thermal-infrared channels.

 MODIS (Terra) Fire and Thermal Anomalies Temporal Coverage: 8 May 2012 – present. The MODIS Fire and Thermal Anomalies layer shows active fire detections and thermal anomalies, such as volcanoes, and gas flares. Fires can be set naturally, such as by lightning, or by humans, whether intentionally or accidentally. Fire is often thought of as a menace and detriment to life, but in some ecosystems it is necessary to maintain the equilibrium, for example, some plants only release seeds under high temperatures that can only be achieved by fire, fires can also clear undergrowth and brush to help restore forests to good health, humans use fire in slash and burn agriculture, to clear away last year’s crop stubble and provide nutrients for the soil and to clear areas for pasture. The fire layer is useful for studying the spatial and temporal distribution of fire, to locate persistent hot spots such as volcanoes and gas flares, to locate the source of air pollution from smoke that may have adverse human health impacts.

