Monitoring air pollutants distribution in urban areas are critical for public health and safety. A country like Pakistan with no network of advanced weather stations to extract high quality data to derive information products is very important. Trend maps of pollutants and other information parameters derived from satellite remote sensing data is a replicable technique to integrate into management decisions. This allows city management to effectively monitor visibility and air quality concerns informing public for to take effective measures.
Following are examples of the available satellite remote sensing products for air quality measurements.
- Aerosol Optical Depth/Thickness product provides information on aerosol in the atmosphere.
- Fires and Thermal Anomalies product shows active fire detection (including crop burning) and thermal anomalies.
- Normalized Difference Vegetation Index (NDVI) is a measure of greeness and health of vegetation.
1. Aerosol Optical Depth
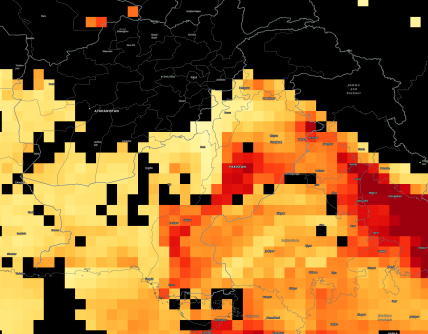
MODIS (Terra and Aqua) Combined Value-Added Aerosol Optical Depth (Temporal Coverage: 31 January 2013 – present). The MODIS (Terra and Aqua) Combined Value-Added Aerosol Optical Depth layer is a value-added layer based on MODIS Level 2 aerosol products. The layer can give a quick, synoptic view of the level of aerosol in the atmosphere.. MODIS Aerosol Optical Depth (or Aerosol Optical Thickness) layer indicates the level at which particles in the air (aerosols) prevent light from traveling through the atmosphere. Aerosols absorb and scatter incoming sunlight, which reduces visibility and increases the optical depth. An optical depth of less than 0.1 indicates a clear sky with maximum visibility, and a value of 1 indicates the presence of aerosols so dense that people would have difficulty seeing the Sun. Aerosols have an effect on human health, weather and the climate. Sources of aerosols include pollution from factories, smoke from fires, dust from dust storms, sea salts, and volcanic ash and smog. Aerosols compromise human health when inhaled by people with asthma or other respiratory illnesses. Aerosols also have an affect on the weather and climate by cooling or warming the earth, helping or preventing clouds from forming.
This level 3 gridded product is designed for quantitative applications including aerosol data assimilation and model validation. This layer is useful for aerosol forecasting communities such as the United States Navy Fleet Numerical Meteorology and Oceanography Center (FNMOC), National Oceanic and Atmospheric Administration (NOAA), European Centre for Medium-Range Weather Forecasts (ECMWF), National Aeronautics and Space Administration (NASA) Global Modeling Assimilation Office (GMAO), University research groups and support for field/aircraft campaigns.
The MODIS Combined Value-Added Aerosol Optical Depth layer is a near real-time layer and available as a combined Terra satellite and Aqua satellite layer (MCDAODHD). The sensor resolution is 0.5 degrees, imagery resolution is 2 km, and the temporal resolution is daily.
References: NASA Earthdata – NRT Value-Added MODIS AOD Product; GCMD Entry: MCDAODHD
2. Fire and Thermal Anomalies
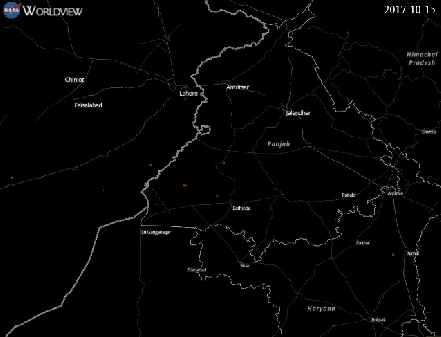 MODIS (Terra) Fire and Thermal Anomalies Temporal Coverage: 8 May 2012 – present. The MODIS Fire and Thermal Anomalies layer shows active fire detections and thermal anomalies, such as volcanoes, and gas flares. Fires can be set naturally, such as by lightning, or by humans, whether intentionally or accidentally. Fire is often thought of as a menace and detriment to life, but in some ecosystems it is necessary to maintain the equilibrium, for example, some plants only release seeds under high temperatures that can only be achieved by fire, fires can also clear undergrowth and brush to help restore forests to good health, humans use fire in slash and burn agriculture, to clear away last year’s crop stubble and provide nutrients for the soil and to clear areas for pasture. The fire layer is useful for studying the spatial and temporal distribution of fire, to locate persistent hot spots such as volcanoes and gas flares, to locate the source of air pollution from smoke that may have adverse human health impacts.
The MODIS Fire and Thermal Anomalies product is available from the Terra (MOD14) and Aqua (MYD14) satellites as well as a combined Terra and Aqua (MCD14) satellite product. The sensor resolution is 1 km, and the temporal resolution is daily. The thermal anomalies are represented as red points (approximate center of a 1 km pixel) in the Global Imagery Browse Services (GIBS)/Worldview.
3. Normalized Difference Vegetation Index (NDVI)
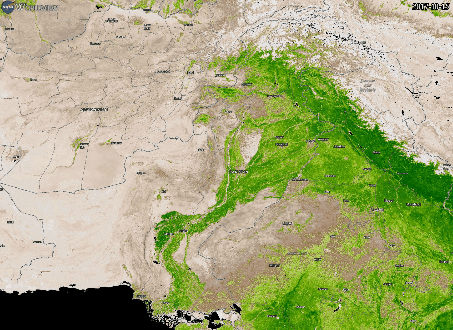
Normalized Difference Vegetation Index (NDVI) (rolling 8-day) MODIS rolling 8-day Normalized Difference Vegetation Index (NDVI). The MODIS Normalized Difference Vegetation Index (NDVI) layer is a measure of the greenness and health of vegetation. The index is calculated based on how much red and near-infrared light is reflected by plant leaves. The index values range from -0.2 to 1 where higher values (0.3 to 1) indicate areas covered by green, leafy vegetation and lower values (0 to 0.3) indicate areas where there is little or no vegetation. Areas with a lot of green leaf growth, indicates the presence of chlorophyll which reflects more infrared light and less visible light, are depicted in dark green colors, areas with some green leaf growth are in light greens, and areas with little to no vegetation growth are depicted in tan colors.
The MODIS rolling 8-day NDVI layer is available as a near real-time, rolling 8-day product (MOD13Q4N) from from the Terra satellite. It is created from a rolling 8-day land surface reflectance product, MOD09Q1N. The sensor resolution is 250 m, imagery resolution is 250 m, and the temporal resolution is an 8-day product which is updated daily.
References: NASA Earth Observatory – Measuring Vegetation; NASA Earthdata – New Vegetation Indices and Surface Reflectance Products Available from LANCE; NASA NEO – Vegetation Index

